Secondary Storage
Overview
Store logs for an extended duration in secondary storage and utilize them later for auditing, troubleshooting, performance tuning, and detecting patterns or anomalies.
Enable Secondary Storage
By default, secondary storage is deactivated for a plugin/document type, requiring manual activation to enable it.
Click here to know how to enable secondary storage for a plugin/document type.
View Logs in Secondary Storage

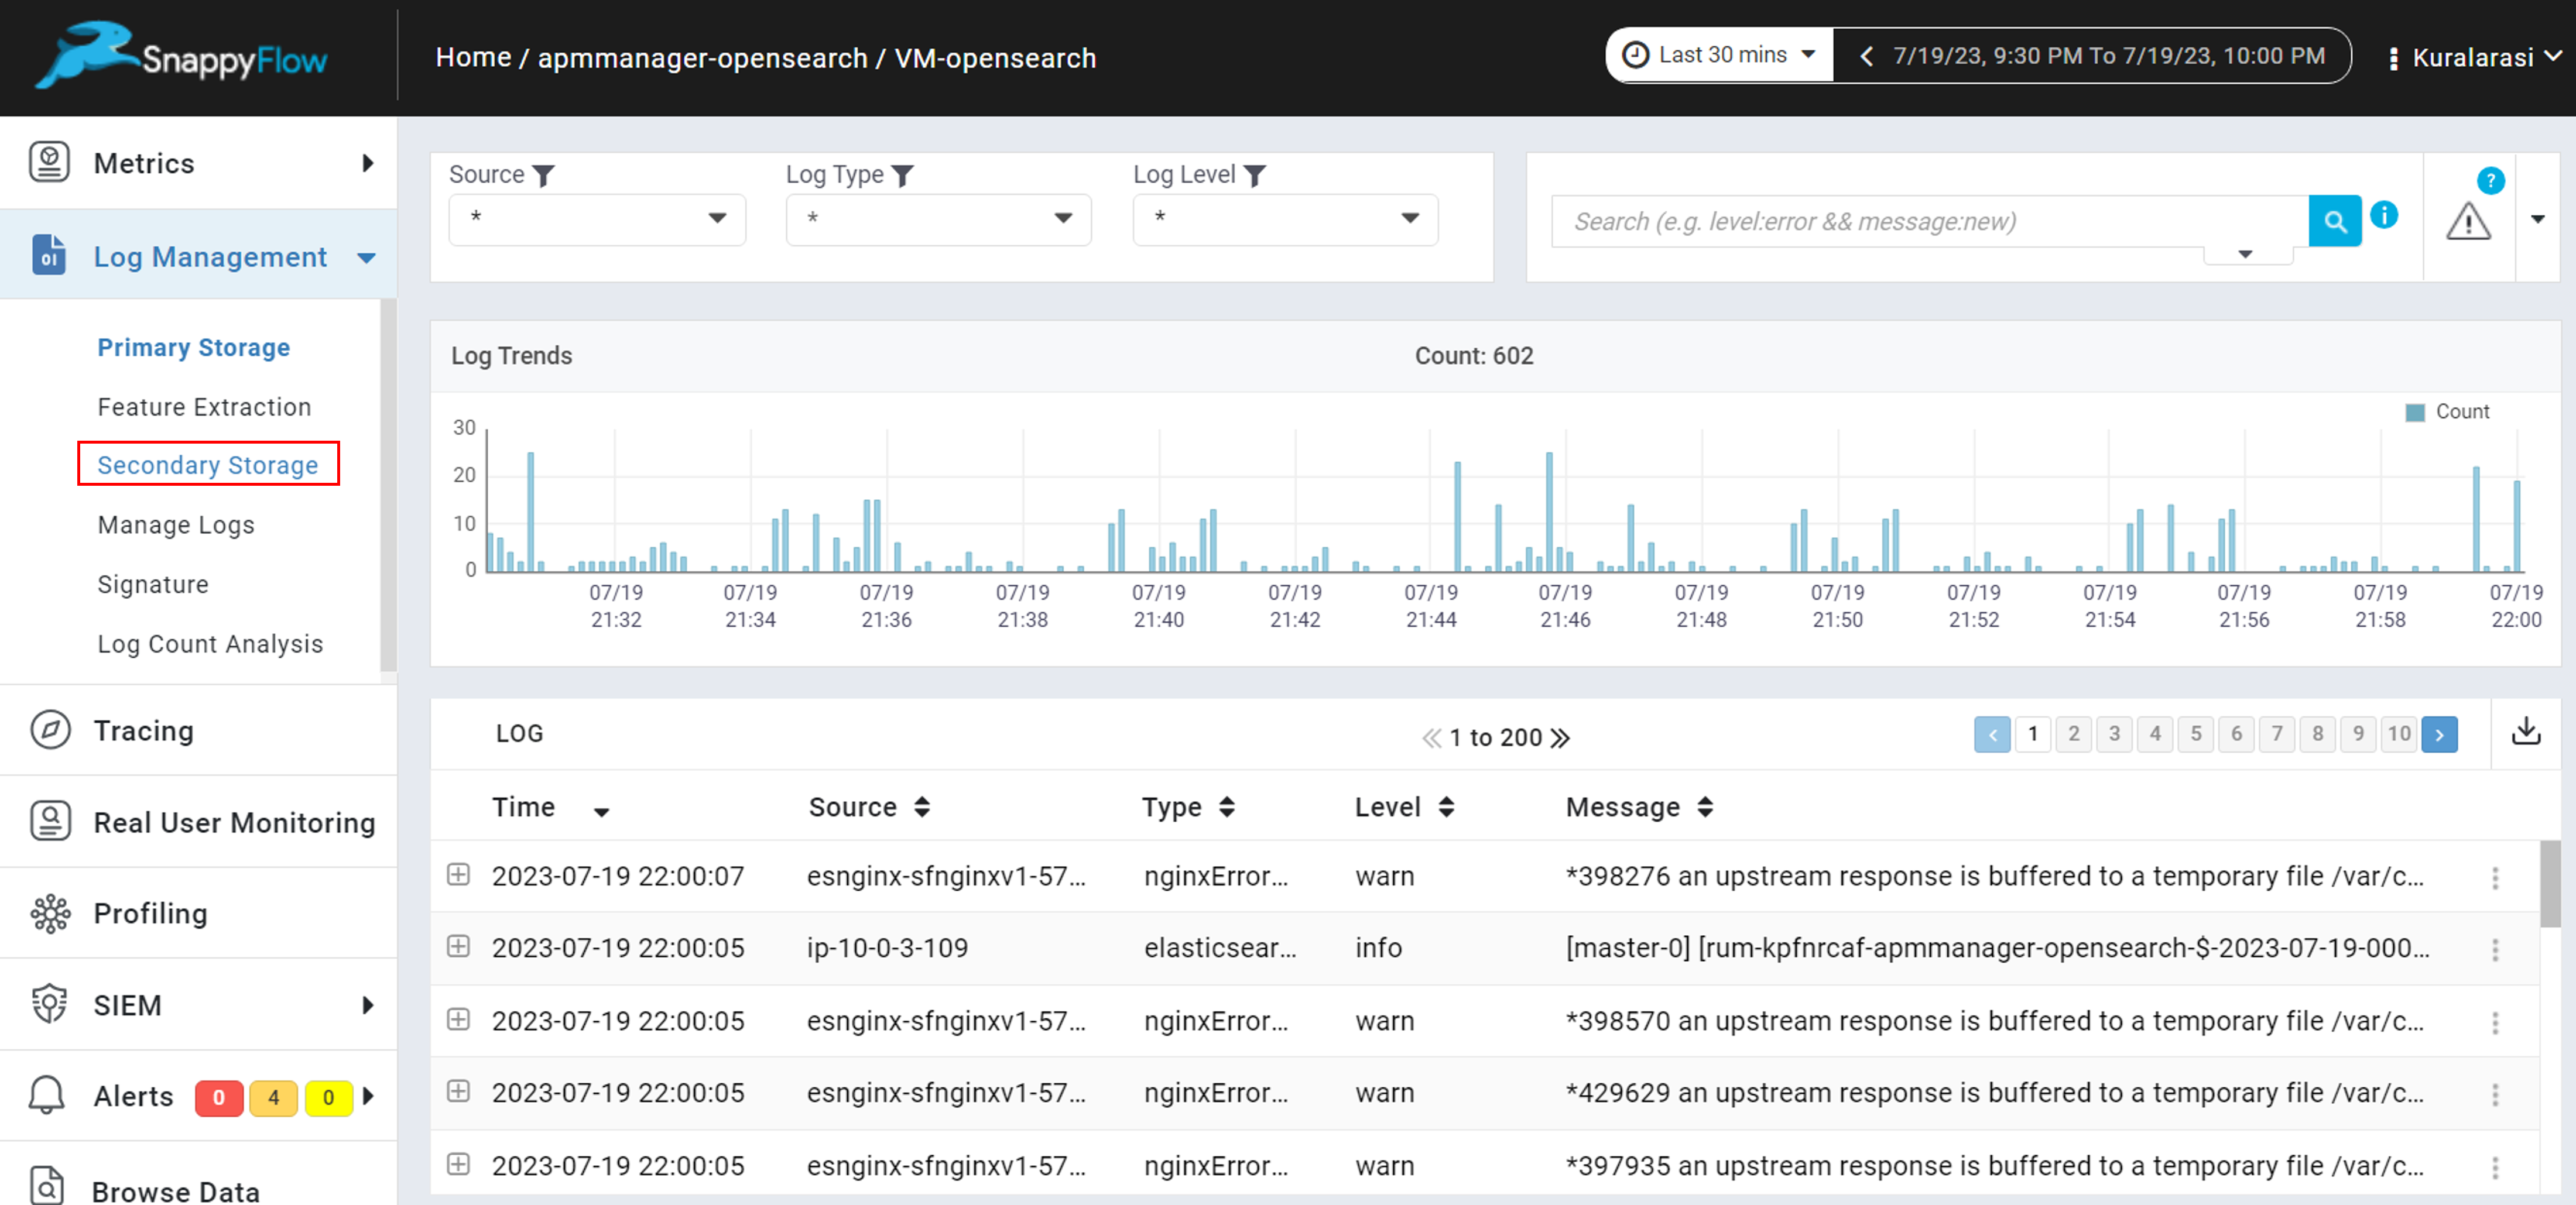
The Logs stored in the secondary storage can be viewed in the Secondary Storage pane of the Log Management section.

The Secondary Storage pane has two tabs:
- Live Data
- Search History
Live Data
In the Live Data pane, histogram data up to 30 minutes before the time of access will be displayed. The first 1000 records for logs are displayed and pagination is enabled for records more than 20.
The logs can be expanded or collapsed to view or copy the logs in a JSON format.
The user can choose from different log types. The corresponding histogram and log data will be fetched for the changed log type.
Zooming on histogram data will fetch the respective zoomed data for histogram and logs. Resetting zoom results in the fetching of data up to the last 30 minutes from the time of access.
Search History
In the Search History pane, you can access all the logs from the moment secondary storage enabled for the plugin and Document Type. You use the following components of the search history pane to access the logs you require.
Log Type
Enable you to filter the logs based on the log type. It simplifies the task of navigating through large volumes of log data, facilitating quicker identification.
Search History
The Search History component stores your search activities and retains them for a specified duration, enabling easy access to previously searched logs.
Filter
The Filter component allows you to set filters for previously searched logs, facilitating more precise and targeted log retrieval. By utilizing this feature, you can quickly narrow down your search results.
Data Range
Specify a particular date range, enabling you to focus on logs generated within that specific timeframe
Advance Settings
Enable retention period for the performed searches.
Search
Execute a search jobs in the search tab and view matching logs and histogram data for the executed search.
Search Query Details
To perform a search job, use the provided operators.
List of Operators
Key value Search (:)
Example
Key:Value
AND operation (&&)
Example
Instance_id && responseCode: 400
OR operation (||)
Example
responseCode: 200||requestSuccess: true
Phrase searches (" ")
Example
message: "Recevied Disconnect from"
Greater than (>)
Example
bytes:>8000
Lesser than (<)
Example
bytes:<8000
Greater than or equal (>=)
Example
bytes:>=8000
Lesser than or equal (<=)
Example
bytes:<8000
Grouping (())
Example
(bytes:(>2000 && <=5000)||Latency:>21) && _plugin:jmeter
NOT operation (-)
Example
_tag_instanceid: (-id1)
Single character wildcard (?)
Example
_plugin: jmet??
Zero or more characters wildcard (*)
Example
message: *exception
Pattern searches (//)
Example
message: /port [0-9]+/
Escape sequence ( \ )
Example
message: sudo\:linux
Examples for Search Query Details
Example 1
Dataset
1.  {
       "pid": 3245,
       "upstream_response_time": 10,
       "URL": "https://www.elastic.co/guide/en/elasticsearch/reference"
    }

2.  {
      "pid": 2445,
      "upstream_response_time": 4,
      "URL": "https://www.elastic.co/guide/en/machine-learning"
    }

3.  {
      "pid": 3246,
      "upstream_response_time": 2,
      "URL": "https://docker-hub/pricing"
    }

4.  {
      "message": "docker image built",
      "pid": 1000
    }
Search Query Detail
| Search Query | Output |
|---|---|
| pid: 3?4? | 1and 3 |

| Search Query | Output |
|---|---|
| upstream_response_time:>5 && elasticsearch | 1 |

| Search Query | Output |
|---|---|
| elastic && machine\-learning | None |

| Search Query | Output |
|---|---|
| www.elastic.co && machine\-learning | 2 |

| Search Query | Output |
|---|---|
| https\:\/\/docker-hub\/pricing | 3 and 4 |

Example 2
Dataset
1.  {
       "message": "Disconnected from 118.24.197.243 port 35662 [preauth]"
    }

2.  {
       "message": "Unregistered Authentication Agent for unix-session:7 (system bus name         :1.89, object path/org/freedesktop/PolicyKit1/AuthenticationAgent, locale en_IN)         (disconnected from bus)"
     }
Search Query Detail
| Search Query | Output |
|---|---|
| "disconnected from" | 1 and 2 |

| Search Query | Output |
|---|---|
| message: (disconnected && from && port) | 1 |

| Search Query | Output |
|---|---|
| message: (disconnect* port) | 1 |

| Search Query | Output |
|---|---|
| message: (disconnected && -port) | 2 |

Example 3
Dataset
1.  {
       "responseCode": "400",
       "responseMessage": Null
    }

2.  {
       "message": "request received from IP1 and redirected to IP2",
       "responseCode": "200"
    }

3.  {
       "message": "ValueError(…)"
    }

4.  {
       "message": "ArithmeticException(…)"
    }
Search Query Detail
| Search Query | Output |
|---|---|
| responseCode: 400 || message: (*exception* || *error*)) | 1, 3 and 4 |

| Search Query | Output |
|---|---|
| -(responseCode: 400 || message: (*exception* || *error*)) | 2 |

Example 4
Dataset
1.  {
       "message": "No identification string for 118.24.197.243"
    }

2.  {
       "message": "No identification string for 119:25.200.255"
    }

3.  {
       "message": "Received bad request from 119:25.200.255"
    }

4.  {
       "message": "pam_unix(sshd:auth): authentication failure; logname= uid=0 euid=0             tty=ssh ruser= rhost=203.195.182.3"
    }

5.  {
       "message": "Authentication failure for user admin"
    }
Search Query Detail
| Search Query | Output |
|---|---|
| message: /[0-9]+.[0-9]+.[0-9]+.[0-9]+/ | 1,2, 3 and 4 |

| Search Query | Output |
|---|---|
| (message: /119.25.[0-9]+.[0-9]+/) | 2 and 3 |

| Search Query | Output |
|---|---|
| auth* && failure && -/[0-9]+.[0-9]+.[0-9]+.[0-9]+/ | 5 |

Example 5
Dataset
1.  {
       "message": "centos:PWD=/home/centos ; USER=root ; COMMAND=/bin/rm -rf jmeter.log"
    }
Search Query Detail
| Search Query | Output |
|---|---|
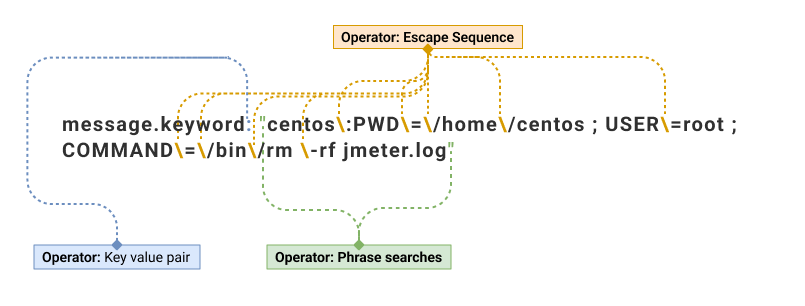
| message.keyword: "centos\:PWD\=\/home\/centos ; USER\=root ; COMMAND\=\/bin\/rm -rf jmeter.log" | 1 |

| Search Query | Output |
|---|---|
| message.keyword: *PWD\=\/home\/centos* | 1 |

| Search Query | Output |
|---|---|
| message: (centos && user && command) | 1 |
