Monitor Document Database
Overview
Amazon DocumentDB makes it easy to set up, operate, and scale MongoDB-compatible databases in the cloud.
Prerequisites
CloudWatch Access for IAM Role
Provide Read only access for CloudWatch to the dedicated IAM Role used for APM. You can use AWS managed polices that addresses many common use cases by providing standalone IAM policies that are created and administered by AWS. Attach this AWS policy CloudWatchReadOnlyAccess to IAM role to get read access for all CloudWatch.
AmazonDocDBReadOnlyAccess
Provides read-only access to Amazon DocDB with MongoDB compatibility. Note that this policy also grants access to Amazon RDS and Amazon Neptune resources.
Required Permissions:
- "rds:DescribeDBClusters"
- "rds:DescribeDBInstances"
- "rds:ListTagsForResource"
- "rds:DescribeCertificates"
SF Poller Configuration
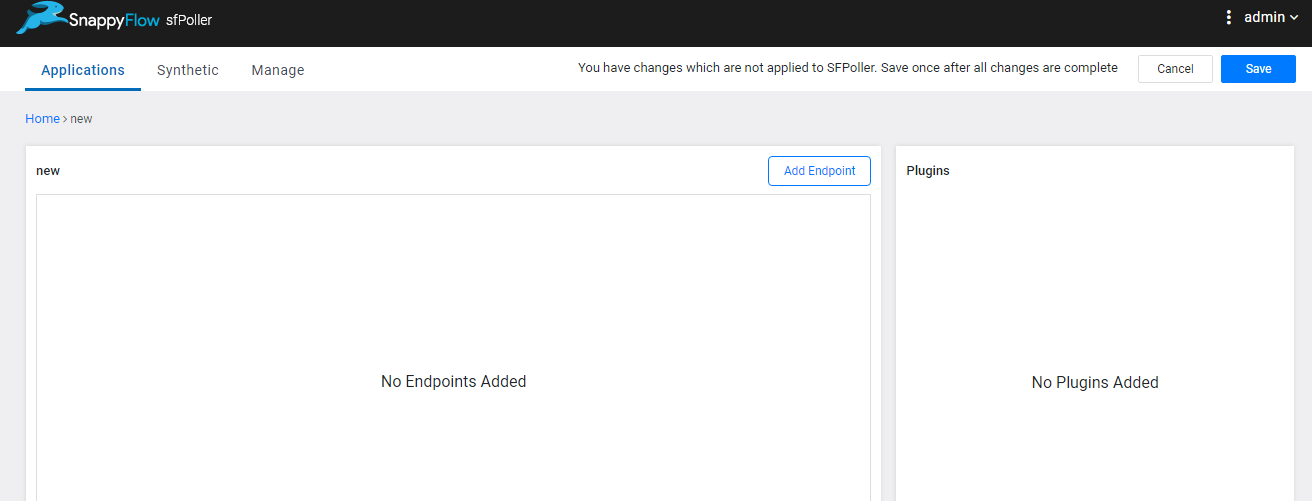
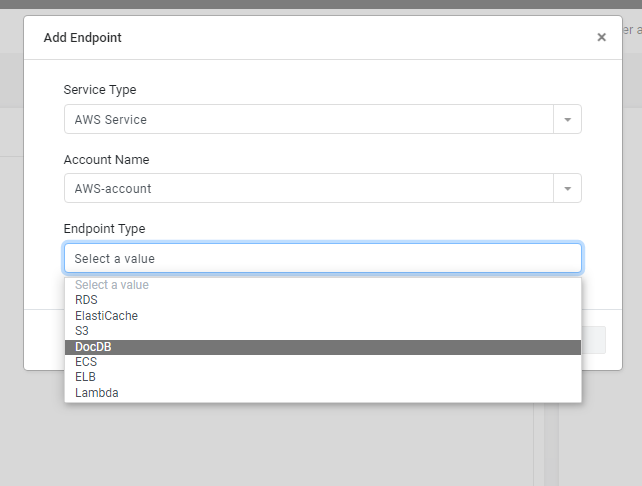
Select DocumentDB Endpoint Type in Add Endpoints and add the Cluster ID
- Add Endpoint
- Select ElastiCache Endpoint
- Enter the ClusterName
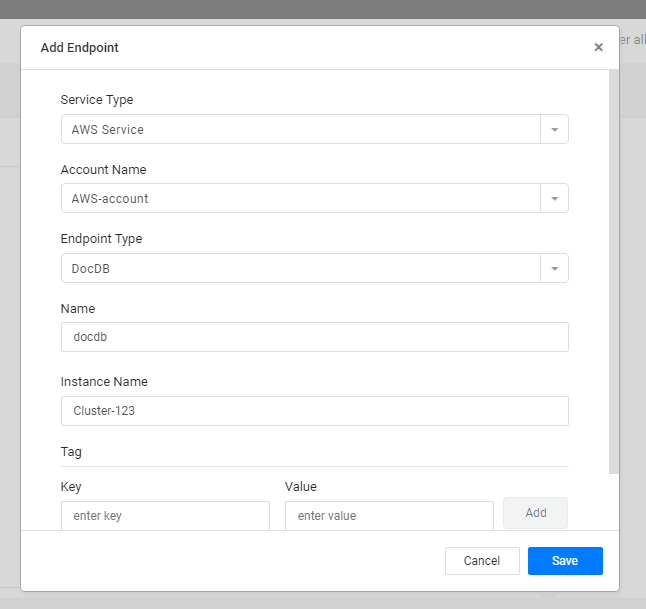
Select the plugin from the dropdown under Plugins tab and config the polling interval. Plugin configuration for DocumentDB services this includes cloudwatch-docdb plugin. You can enable/disable any of the plugin based on your needs and instance support.
cloudwatch-docdb: A monitoring support for AWS DocuemntDB Cluster, collects all the cluster level and instance level metrics.
Metrics list:
Resource Utilization Stats:
| Metric | Description |
|---|---|
| BackupRetentionPeriodStorageUsed | The total amount of backup storage in GiB used to support the point-in-time restore feature within the Amazon DocumentDB's retention window. |
| ChangeStreamLogSize | The amount of storage used by your cluster to store the change stream log in megabytes. |
| CPUUtilization | The percentage of CPU used by an instance. |
| DatabaseConnections | The number of connections open on an instance taken at a one-minute frequency. |
| DatabaseConnectionsMax | The maximum number of open database connections on an instance in a one-minute period. |
| DatabaseCursors | The number of cursors open on an instance taken at a one-minute frequency. |
| DatabaseCursorsMax | The maximum number of open cursors on an instance in a one-minute period. |
| DatabaseCursorsTimedOut | The number of cursors that timed out in a one-minute period. |
| FreeableMemory | The amount of available random access memory, in bytes. |
| FreeLocalStorage | This metric reports the amount of storage available to each instance for temporary tables and logs. |
| LowMemThrottleQueueDepth | The queue depth for requests that are throttled due to low available memory taken at a one-minute frequency. |
| LowMemThrottleMaxQueueDepth | The maximum queue depth for requests that are throttled due to low available memory in a one-minute period. |
| LowMemNumOperationsThrottled | The number of requests that are throttled due to low available memory in a one-minute period. |
| SnapshotStorageUsed | The total amount of backup storage in GiB consumed by all snapshots for a given Amazon DocumentDB cluster outside its backup retention window. |
| SwapUsage | The amount of swap space used on the instance. |
| TotalBackupStorageBilled | The total amount of backup storage in GiB for which you are billed for a given Amazon DocumentDB cluster. |
| TransactionsOpen | The number of transactions open on an instance taken at a one-minute frequency. |
| TransactionsOpenMax | The maximum number of transactions open on an instance in a one-minute period. |
| VolumeBytesUsed | The amount of storage used by your cluster in bytes. This value affects the cost of the cluster. For pricing information |
Operation Stats:
| Metric | Description |
|---|---|
| DocumentsDeleted | The number of deleted documents in a one-minute period. |
| DocumentsInserted | The number of inserted documents in a one-minute period. |
| DocumentsReturned | The number of returned documents in a one-minute period. |
| DocumentsUpdated | The number of updated documents in a one-minute period. |
| OpcountersCommand | The number of commands issued in a one-minute period. |
| OpcountersDelete | The number of delete operations issued in a one-minute period. |
| OpcountersGetmore | The number of getmores issued in a one-minute period. |
| OpcountersInsert | The number of insert operations issued in a one-minute period. |
| OpcountersQuery | The number of queries issued in a one-minute period. |
| OpcountersUpdate The | number of update operations issued in a one-minute period. |
| TransactionsStarted | The number of transactions started on an instance in a one-minute period. |
| TransactionsCommitted | The number of transactions committed on an instance in a one-minute period. |
| TransactionsAborted | The number of transactions aborted on an instance in a one-minute period. |
| TTLDeletedDocuments | The number of documents deleted by a TTLMonitor in a one-minute period. |
Throughput Stats:
| Metric | Description |
|---|---|
| NetworkReceiveThroughput | The amount of network throughput, in bytes per second, received from clients by each instance in the cluster. |
| NetworkThroughput | The amount of network throughput, in bytes per second, both received from and transmitted to clients by each instance in the Amazon DocumentDB cluster. |
| NetworkTransmitThroughput | The amount of network throughput, in bytes per second, sent to clients by each instance in the cluster. |
| ReadIOPS | The average number of disk read I/O operations per second. |
| ReadThroughput | The average number of bytes read from disk per second. |
| VolumeReadIOPs | The average number of billed read I/O operations from a cluster volume, reported at 5-minute intervals. Billed read operations are calculated at the cluster volume level. |
| VolumeWriteIOPs | The average number of billed write I/O operations from a cluster volume, reported at 5-minute intervals. Billed write operations are calculated at the cluster volume level, aggregated from all instances in the cluster. |
| WriteIOPS | The average number of disk write I/O operations per second. |
| WriteThroughput | The average number of bytes written to disk per second. |
System Stats:
| Metric | Description |
|---|---|
| BufferCacheHitRatio | The percentage of requests that are served by the buffer cache. |
| DiskQueueDepth | the number of concurrent write requests to the distributed storage volume. |
| EngineUptime | The amount of time, in seconds, that the instance has been running. |
| IndexBufferCacheHitRatio | The percentage of index requests that are served by the buffer cache. |
Latency Stats:
| Metric | Description |
|---|---|
| DBClusterReplicaLagMaximum | The maximum amount of lag, in milliseconds, between the primary instance and each Amazon DocumentDB instance in the cluster. |
| DBClusterReplicaLagMinimum | The minimum amount of lag, in milliseconds, between the primary instance and each replica instance in the cluster. |
| DBInstanceReplicaLag | The amount of lag, in milliseconds, when replicating updates from the primary instance to a replica instance. |
| ReadLatency | The average amount of time taken per disk I/O operation. |
| WriteLatency | The average amount of time, in milliseconds, taken per disk I/O operation. |
View Data and Dashboards:
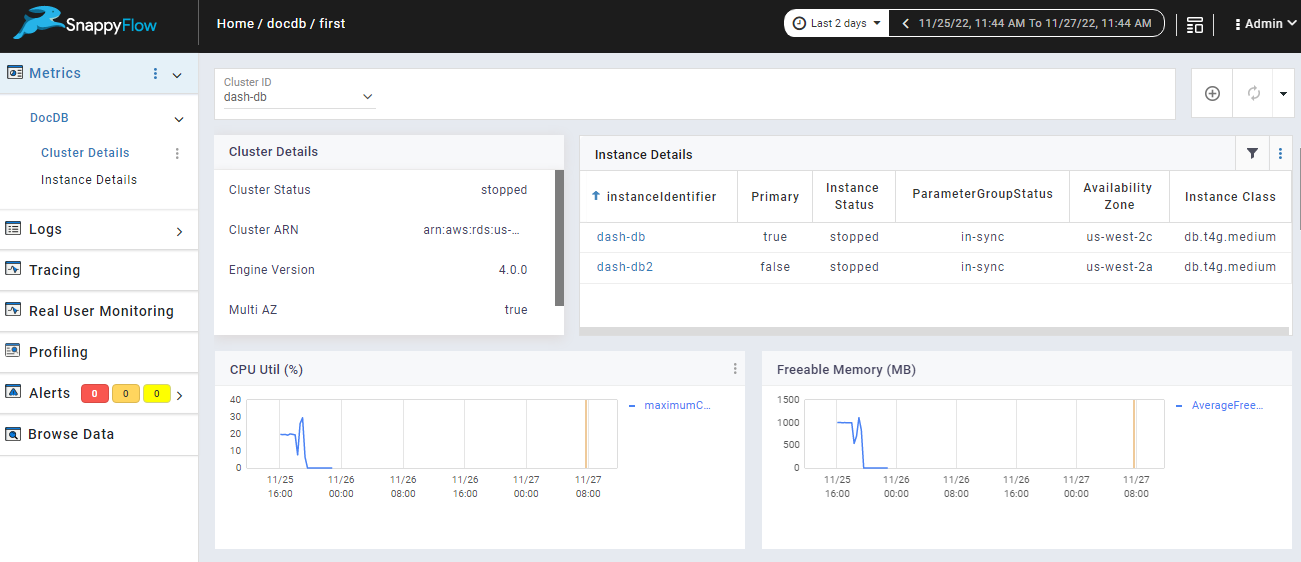
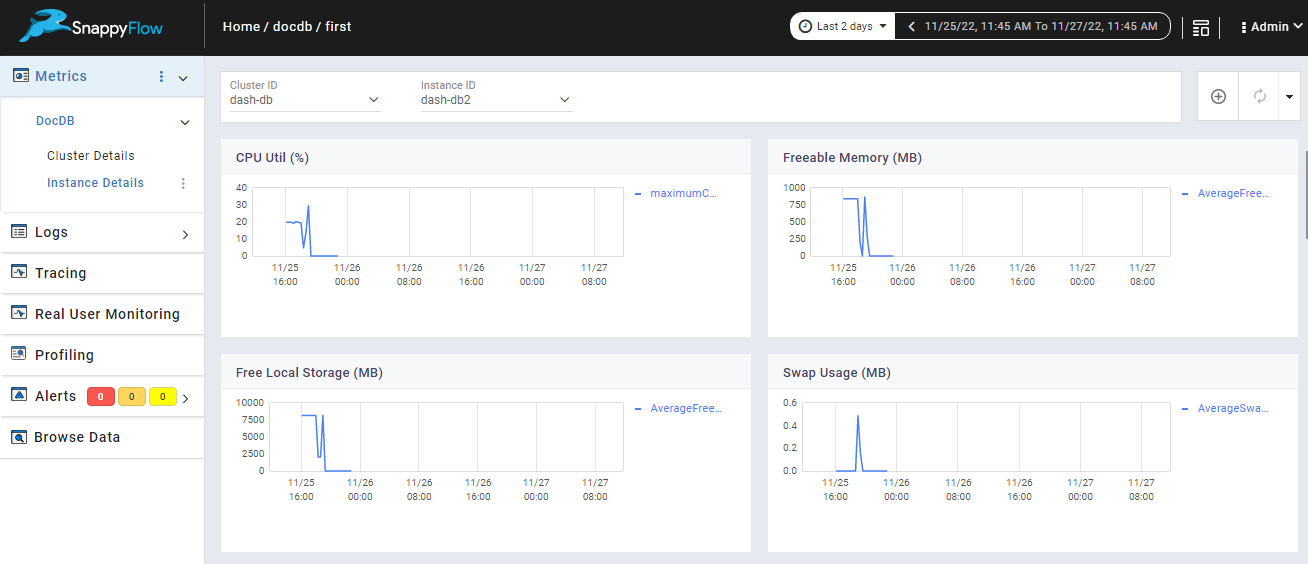
Data collected by plugins can be viewed in SnappyFlow’s browse data section
- Plugin = DocDB
- DocumentType = OperationStats,clusterDetails instanceDetails, latencyStats,resourceUtilizationStats, systemStats, throughputStats
- Dashboard template: DocDB
