Summary Box
Create a Summary Box
Follow the below steps to create Tabbed Table
Click the
+icon on the top right corner of the dashboard.Select
Summary Boxoption from the drop-down.The settings window will pop up, add the basic and advanced details based on the requirement.
Summary Box Settings
The Summary Box settings window has three major tabs.
Main - Primary details about the Tabbed Table component.
Advanced - Customize options.
JSON Editor - Add properties to the advanced options.
Main
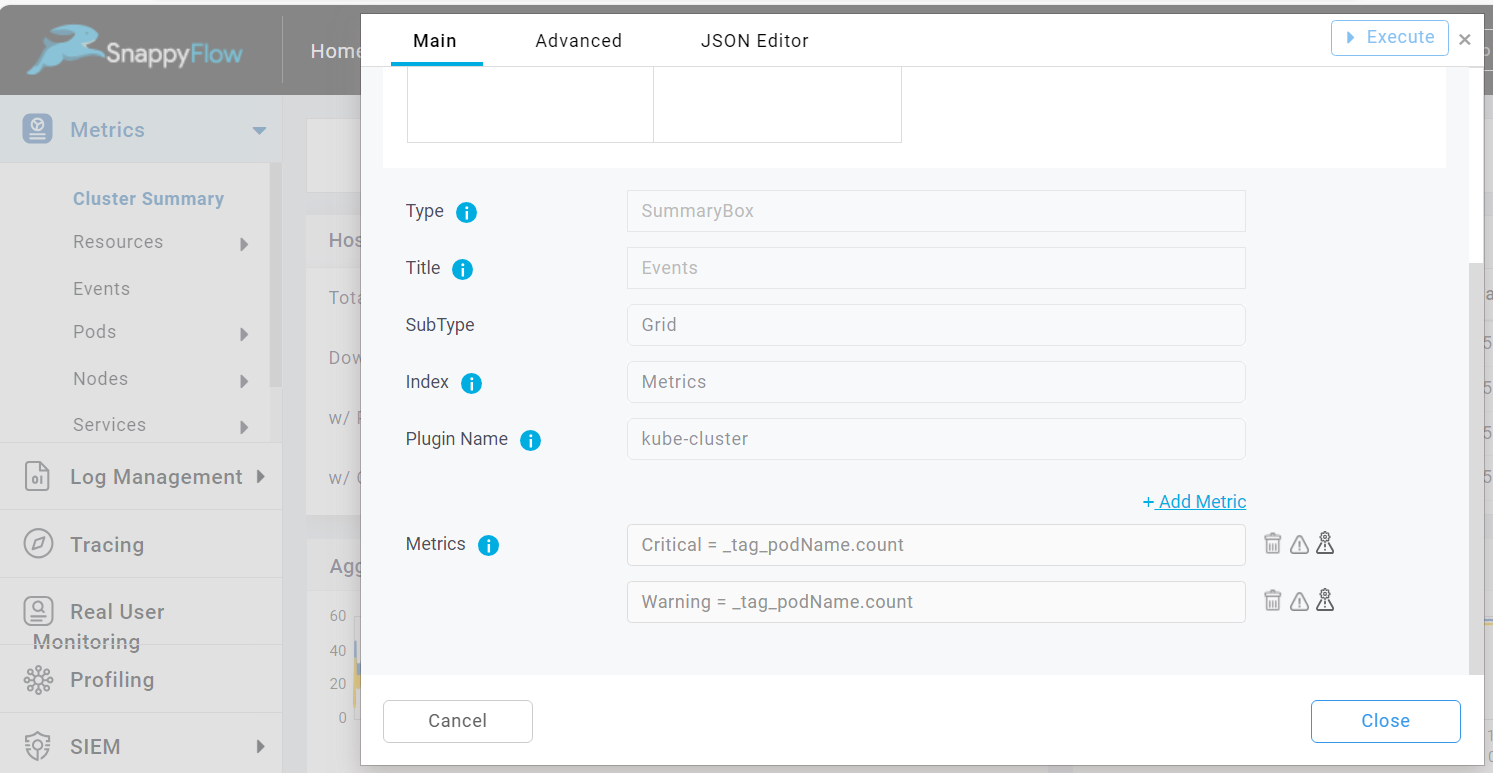
The Main tab gives you option to add basic information about the summary box as given below:

Title: Title of the summary box.
SubType: Select a sub type (Grid or List) for the summary box.
Index: Select an Index (Metrics, Log, Tracing ) from which data to be fetched for the summary box
Plugin Name: Select a plugin name to associate with the summary box. Example: Apache-access, linux, postgres
Metrics: You can add any number of metrics using '+Add Metric' option.
Advanced options
Size
It gives you the option to edit the size of the summary box. Give the width and height value to alter the size of the summary box.
General
Metric Properties
The metric Properties option enables you to customize the visualization of the data in summary box. The following values combinedly know as metric properties: Rate, Decimal, Format, Box color, Text color.
To enable the metric properties, check the Metric Properties checkbox.
Once the metric properties is enabled, you can view the list of metric properties in the JSON Editor tab.
Split
Query
Combined Query
2nd order Summarization
Render
Nested List
Add Nested Fields
Time
Time property is as same as Table component. Refer to Table component for details.
